
What's New
Version 12 Latest
Added Feature:
1. Replaced ‘Tax’ sheet with ‘Capital Gains’ sheet for more detailed realized gains/losses insights.
Tweak:
1. Upgraded benchmark calculation method to simulate proportional liquidation.
2. Optimized scripts for improved calculation speed and execution.
3. Enhanced Add Asset script to validate and auto-correct Google symbol format.
Version 11.2
Tweak:
1. The NAV column in the Portfolio History sheet is now calculated using Scripts instead of formula.
2. Daily change in the Portfolio History sheet is now calculated based on the NAV column instead of the Market Value.
3. Optimized Live Price formula
4. Updated Import Function to support v10 and above only. Removed support for older versions.
Fix:
1. Fixed the Clear All Data function to include the Log Date column in the Transactions sheet.
Version 11.1
Fix:
1. Fixed Refresh Transaction Data function to include Log Date column.
Version 11
Added Feature:
1. Now Asset Names in the Portfolio sheet work as clickable links to their Screener Webpage.
2. Added dynamic links in the Portfolio, to quickly jump straight to TradingView for detailed charts and analysis..
3. XIRR calculations are now more advanced. User can now switch XIRR calculation methods between "All-Time" or "Active" holdings.
Tweak:
1. Now Portfolio Performance measured using unitized NAV, which removes cashflow distortion and reflects true performance.
Removed:
1. Days count from the Portfolio sheet.
2. Unncessary Conditional Formating.
Version 10.3
Tweak:
1. Script Improvements.
Version 10.2
Added Feature:
1. Ability to view allocation in the Portfolio Sheet by Asset Type or for the Entire Portfolio.
2. Added Drop down to switch allocation calculation between Investment Value and Current Value.
3. Now Dashboard can show Monthly Investment needed for reaching the Target.
Version 10.1.2
Tweak:
1.Optimized few formulas
Fix:
1.Errors in formulas
Version 10.1.1
Fix:
1.Errors in formulas
Version 10.1
Fix:
1. Number rounding issue.
2. Error in Benchmark Calculation.
Version 10
Added Feature:
1. Custom Daily Alerts
2. Added Holding Duration in Portfolio Sheet.
3. Added more useful insights in Portfolio Sheet.
4. Added option to disable recording Daily Value of an Asset.
Tweak:
1. Made some changes in the sheet structure.
Version 9
Added Feature:
1. Now Tax Sheet can able to show Quarters wise gains for the selected Financial Year.
2. Now Overview Sheet can show Unrealized Long Term & Short Term gains or losses.
3. For Tax calculations purpose now Charges has divided in to two categories Charges(A) – which are deductible from gains, Charges(B) – which are not deductible from gains.
4. Now users can delete Transactions using Add Transactions Form.
Tweak:
1. Optimized Scripts for faster calculations.
Fix:
1. Errors in some Scripts.
Version 8.1
Added Feature:
1. Added Portfolio Returns Chart in Dashboard.
2. Now Dashboard can show Portfolio CAGR and Future estimated value.
Fix:
1. Errors in some Scripts.
2. Optimized some Formulas.
Version 8
Added Feature:
1. Ability to change Asset Names in Data Sheets.
2. Added ERASE button to erase all the data in the Portfolio Tracker
Tweak:
2. Instead of fetching the XIRR separately for each asset from the Overview sheet, the script now itself calculates XIRR directly, delivering more faster results.
3. Optimized Formulas.
Version 7
Added Feature
1. Can record daily Invested Value, Market Value for every asset in the Portfolio. All this data will be recorded in a new workbook called “Asset History”.
2. Now, Portfolio Performance Graph can show Invested Value along with Market Value.
3. Ability to Import new data without overwriting existing data.
Fix:
1. Fixed errors for SPIN-OFF transactions in FIFO and Tax Script.
Version 6.1
Tweak:
1. In Tax sheet, if Apply Indexation is turned off, instead of value 0 now its shows Cost of Acquisition.
Version 6
Added Feature:
1. Added What If feature in the Dashboard sheet, which helps in testing and analyzing how the portfolio would react under different market conditions.
2. Reintroduced Short Term and Long Term units in the Overview sheet (previously formula-based, now script-driven).
3. Added the “Enable Scripts” button in the Disclaimer sheet to enable scripts and add all required triggers with a single click, eliminating the need for manual trigger setup.
Version 5.2
Added Feature:
1. Added drop downs in Tax sheet to calculate estimated Taxes for individual Stock, Mutual Funds and ETFs.
Removed:
1. Due to errors removed, Short Term and Long Term units of an Asset in Overview sheet.
Version 5.1
Added Feature:
1. To view Short Term and Long Term units of an Asset in Overview sheet.
Fix:
1. Errors in Tax script
Version 5
Added Feature:
1. Introduced a new Tax sheet for instant STCG and LTCG calculations with a single click.
2. Added the ability to customize tax rates and exemption limits for Stocks, Mutual Funds (Equity, Debt, and ELSS) and ETFs.
3. Can estimate total tax with or without Indexation.
Version 4
Added Feature:
1. Now can filter data based on Sector/Category in Portfolio Sheet.
2. Added a Refresh button in the Overview Sheet that optimizes data in the Transactions Sheet by sorting data chronologically, clearing empty rows between data and recalculate FIFO values.
3. Now Portfolio Sheet can show Trend based on Simple Moving Average.
Tweak:
1. Optimized Formulas.
Fix:
1. Minor Bug Fixes
2. Fixed Errors and updated FIFO Script for more accuracy.
Version 3.2
Added Feature:
1. To view daily, weekly, 1 month, 6 month, 1 year and 5 year portfolio return compared to selected Benchmark
2. To view Live Price, Average Buy Price, Lowest Buy Price and Highest Buy price of an Asset and Asset Types in Overview sheet.
Tweak:
1. Added drop down to view Top 5 and Bottom 5 Stocks, Mutual Funds and ETFs in Dashboard Sheet.
2. Updated Portfolio Performance Chart
3. Added Dividends Income Chart
Fix:
1. Fixed, charges not Including while calculating FIFO
Version 3.1.1
Tweak:
1. Updated Scripts
Version 3.1
Added feature:
1. Now filter transactions in Overview sheet using Dates.
Tweak:
1. Sell and Withdraw transactions are now handled using the FIFO method.
Version 3
Added feature:
1. Import Data from previous version sheets to this Updated Sheet.
2. Abitility to track ETFs and Mutual Funds.
3. Now Dashboard can show Investments in Stocks, ETFs and Mutual Funds seperatly.
4. Know Standard Deviation at Portfolio Performance Graph.
Tweak:
1. Optimized XIRR and Benchmark Calculations and moved them to Transactions Sheet.
Version 2.1
Added feature:
1. For adding Demerge (Spin-Off) Transactions.
Version 2
Initial Release
Google Sheets
Portfolio Tracker
Best free google sheet stock market portfolio tracker in 2026 . Free Stock Market Investments Tracker made with Google Sheets to track Stocks, Mutual Funds, ETFs. XIRR Performance, Benchmark Comparison, capital gains calculator, long term capital gains, short term capital gains with indexation benefit.
Unify All Your Stock Market Investment Transactions in One Place with this Ultimate Google Sheet Portfolio Tracker for Free.
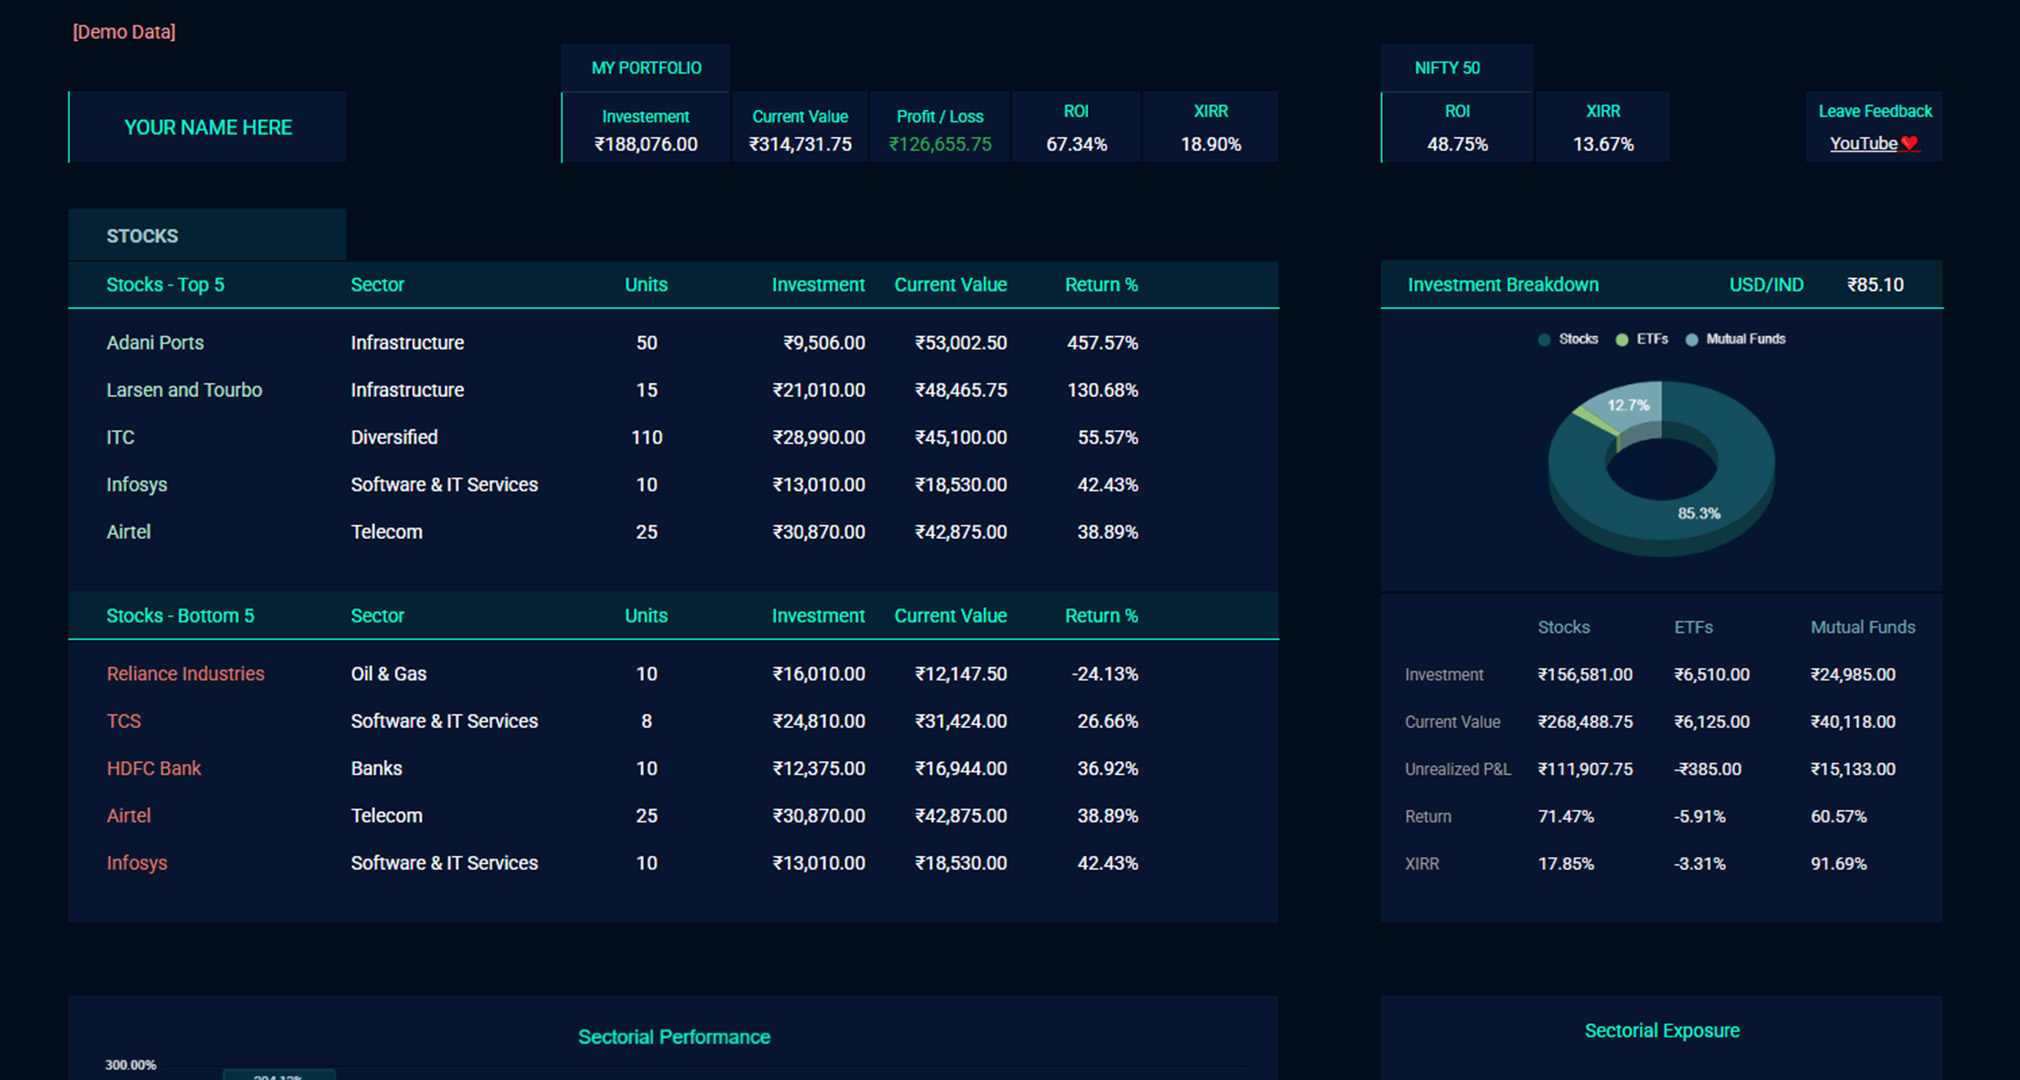
Dynamic Dashboard
Easily visualize your entire investment portfolio using a powerful dynamic dashboard. Track stocks, mutual funds, and ETFs with clear visuals.
Benchmark Comparision
Compare your portfolio's performance against top stock market benchmarks. This free investment tracker gives you insights on where you stand.
Transaction Forms
Add or edit transactions with ease using dedicated forms. Whether it's a stock buy, mutual fund SIP, or ETF sell, every action is recorded accurately.
XIRR
Get XIRR for your stocks, mutual funds, and ETFs. No formulas to write, just plug in your transactions and let this investment tracker do the rest for you.
Coporate Actions
Track major corporate actions like stock splits, bonuses, dividends, and demergers. This free portfolio tracker adjusts your holdings and cost basis using FIFO logic.
Track Mutual Funds & ETFs
Track every SIP and Withdraws with ease. Supports detailed mutual fund and ETF investment tracking. Capital Gains Calculation.

Apps Script
This Google Sheets portfolio tracker uses Apps Script to automate FIFO, Short Term Capital Gains (STCG), Long Term Capital Gains (LTCG), and Tax estimation, while offering tools to clean data, track stocks, mutual funds, and ETFs efficiently.
Dashboard Sheet
Interactive dashboard sheet that provides detailed investment insights with dynamic charts, portfolio breakdowns, and performance graphs for smart decision-making.
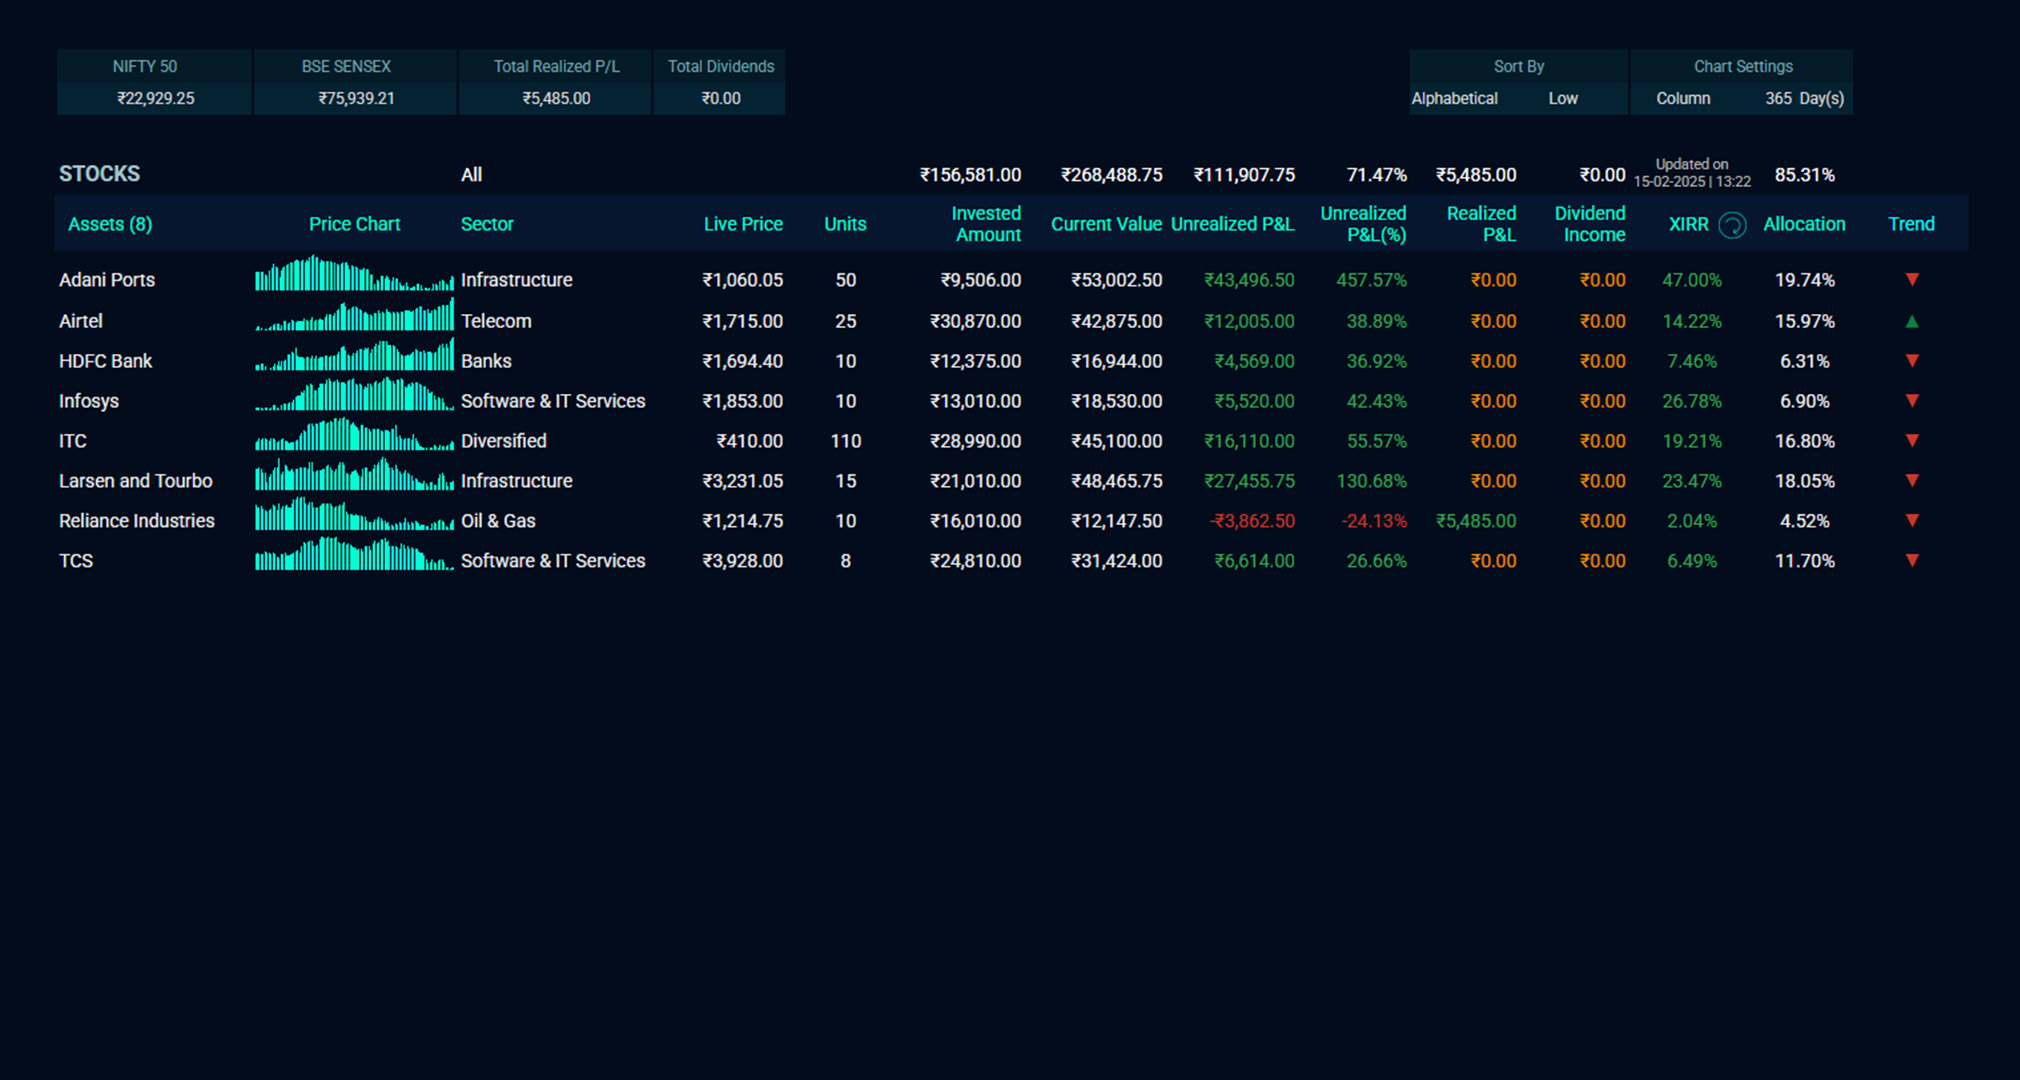
Portfolio Sheet
The Portfolio sheet showcases all your stocks, mutual funds, and ETFs in one place with customizable mini charts, providing quick visual insights into performance, diversification, and investment trends at a glance.
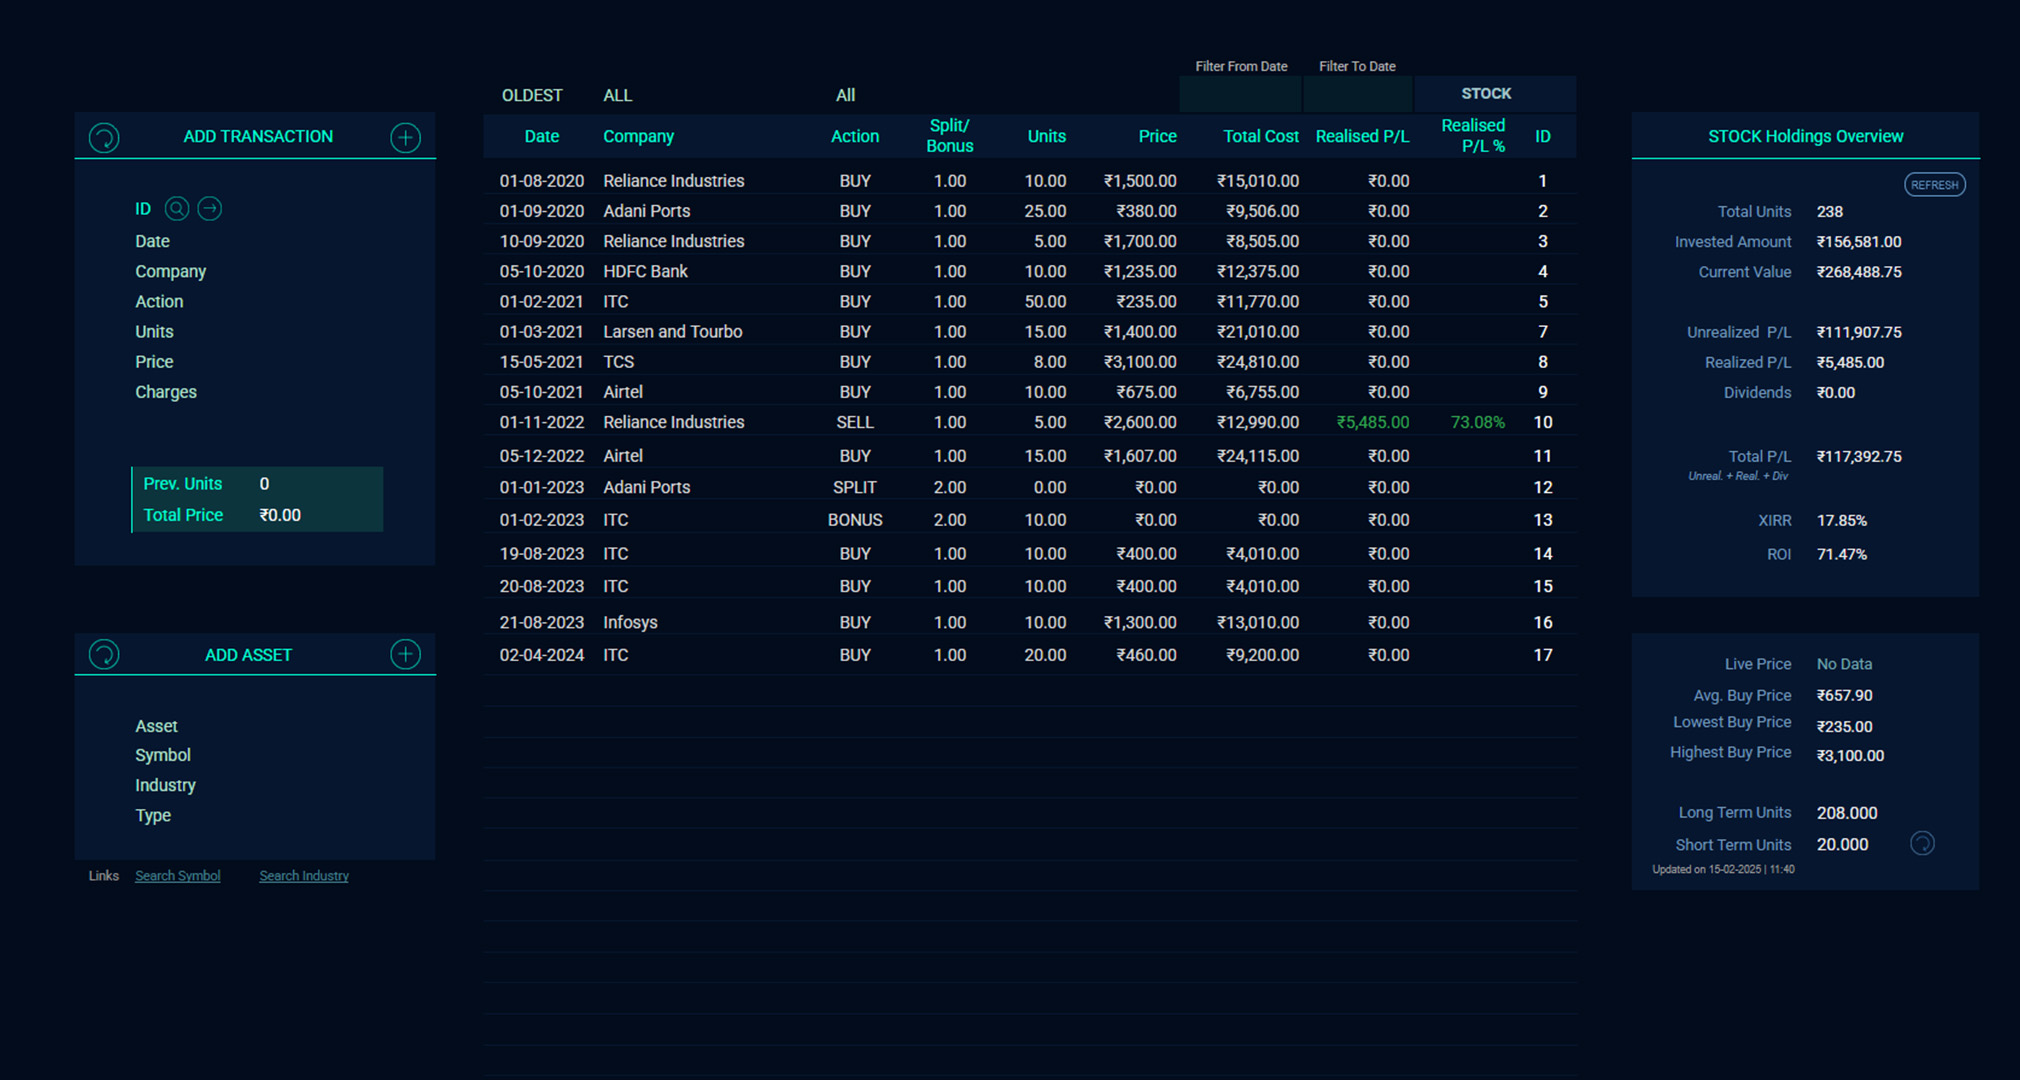
Overview Sheet
The Overview sheet serves as a central hub to add transactions through forms, track all entries, and view detailed insights for each stock, mutual fund, and ETF in your portfolio.